1. Motivation
Despite being a foundational input to every solar PV energy yield assessment, surprisingly the selection and treatment of meteorological datasets receives little open discussion in the industry. Most engineers default to familiar tools or follow house rules without fully interrogating the assumptions underneath. As a solar design engineer who has worked across multiple projects and engaged with data providers, independent assessors, and fellow practitioners, this article aims to surface the key challenges, available options, and practical methods worth considering — not as a definitive rulebook, but as a contribution to a conversation I think industry should be having more openly.
Some areas of the article are written for less technical readers, so if you are an expert please bear with me while I explain some core principles. Feel free to skip to any section of interest.
2. Introduction
Solar PV simulations are computational models used to predict the technical performance of such systems. They simulate how a solar PV system will operate under localised environmental conditions over time, estimating the system's energy production (kWh), a process also known as Energy Yield Assessment (EYA).
There are several specialised software tools for solar PV simulations, more coming out in recent years, however PVsyst has always stood out as a widely used and trusted software, known for its comprehensive modelling capabilities and accuracy. Many may disagree and point out some newer tools that use more complex calculation methods including ray-tracing which is very compute intense, and I have always argued whether the claimed added benefit outweighs the additional computational cost, perhaps in very specific minor cases, however this is not the main point of discussion here.
PVsyst is referenced here to demonstrate how typical EYAs work and what data they require with many principles apply to other similar software. PVsyst rightfully gained its popularity due to its ability to simulate detailed energy yields based on precise meteorological data, system configuration, and loss factors. It is often used by engineers, developers, and financiers because its results are bankable, i.e. accepted by lenders, investors and independent engineers (IEs) to assess project feasibility and financial viability.
Such simulations use historical meteorological (weather) data to estimate the potential annual energy generation of PV systems. This data is commonly presented in a format called Typical Meteorological Year (TMY), which represents a synthesised set of meteorological data that simulates a typical year of weather conditions at a given location. A TMY precisely is a single, representative 8,760-hour dataset compiled from actual historical weather segments—specifically, 12 individual calendar months selected from a multi-decade period (usually 15–30 years). Using the industry-standard Sandia Method, providers evaluate candidate months based on Finkelstein-Schafer (FS) statistics to find the ones whose cumulative distribution functions most closely mirror long-term historical averages for key metrics like solar irradiance and temperature. After filtering out months with extreme weather streaks via persistence checking, the final twelve selected months—potentially from entirely different years—are concatenated and smoothed at their boundaries using a blending filter to ensure a seamless meteorological transition for solar or building performance simulation.
Potential Limitations of TMY
Given the nature of TMY data, it is natually considered best for project planning, system design, and long-term energy yield estimations, offering a simplified and standardised representation of a typical year, without the need to handle large, complex datasets, such as Time Series Data, representing individual years which is essential for operational monitoring, short-term forecasting, and detailed performance simulations under certain circumstances and use-cases because it reflects real-world variability, including extreme events. While TMY data is optimal for long-term P50 planning and has always been used for solar projects, it lacks the real-world inter-annual variability found in historical time-series data, which is increasingly required for short-term forecasting, operational benchmarking, and Battery Energy Storage System (BESS) integration.
Having said that, it is worth noting that recent studies promoting the wholesale shift to Time Series data often rely on extreme climate anomalies—such as Solargis’s use of the 2021 Texas winter storm—to demonstrate TMY failures (Celik, 2025). While this effectively highlights risk-mitigation benefits for extreme events, it risks overstating the case against TMY data for routine, bankable energy yield estimations where statistical averages remain perfectly adequate.
It is also important to separate meteorological data from site-specific environmental losses, as limitations in modelling near-shading or soiling are often incorrectly attributed to TMY datasets. In simulation tools like PVsyst, near-shading and horizon obstructions are addressed by importing site-specific far-horizon profiles or 3D CAD scenes. The software then applies these spatial obstructions directly to the TMY irradiance time-steps. Similarly, soiling is typically handled within the software as a user-defined monthly profile or annual factor. While advanced, rainfall-dependent dynamic soiling models do benefit from multi-year Time Series data, standard shading and soiling configurations are not limitations of TMY data itself, but rather independent design inputs handled during the simulation layout phase.
3. Meteorological Data
In addition to the system details and loss parameters, PVsyst takes TMY meteo parameters as inputs to simulate the system’s performance and estimate energy yield. TMY data typically include the following key meteo parameters:
1. Global Horizontal Irradiance (GHI): Total solar radiation on a horizontal surface, a critical input for solar energy production.
2. Diffuse Horizontal Irradiance (DHI): Part of the sunlight scattered by the atmosphere and reaching the earth's surface on a horizontal plane.
3. Direct Normal Irradiance (DNI): Solar radiation that comes in an unobstructed straight line from the sun, specifically more important for systems with tracking.
4. Temperature (Ambient): Affects the operating temperature of the solar modules, which in turn influences their efficiency.
5. Wind Speed: Influences the cooling of the PV modules, which can help improve module performance at higher temperatures.
6. Relative Humidity: Plays a role in determining the dew point and atmospheric conditions.
7. Albedo: A measure of reflectivity of the ground's surface. Data providers are now offering satellite-derived dynamic monthly or hourly albedo datasets, which significantly reduce uncertainty in bifacial PV energy yield assessments.
Meteo data can be classified based on the way the data is measured into three main types, and each has distinct characteristics based on how the data is collected, processed, and applied. Understanding the differences between these sources helps to choose the best dataset for accurate energy yield prediction, however this is also governed by data availability in the location of interest. The data types are:
1. Terrestrial data: based on ground measurements, ideal for high precision, but is limited by coverage and potential data gaps.
2. Satellite-derived data: based on satellite images and computational models, provides wide coverage and consistent temporal data, but with lower accuracy at the local level.
3. Hybrid datasets: combine the strengths of both, offering accurate and reliable data for areas with and without ground stations.
3.1. Meteo Data Providers
There are many TMY data providers in the market with varying popularity and adoption rate by developers and designers. The choice of TMY data source depends on the geographical region of interest, required resolution, cost, and specific needs of the service. The main ones that offer good coverage of Europe are listed below. While many solar data providers use satellite-based data, they source satellite data from various global and regional providers, often using publicly available datasets and sometimes purchasing higher-resolution data. In addition to TMY data, many if not all providers offer time series data as well.
An overview of some of the main meteo data providers are listed below:
1. PVGIS (Photovoltaic Geographical Information System) - https://re.jrc.ec.europa.eu/pvg_tools/en/
- Source: Developed by the European Commission’s Joint Research Centre (JRC) – 2001.
- Type: Satellite-derived dataset with a focus on European, African, and parts of Asian regions.
2. Meteonorm - https://meteonorm.com/en/
- Source: Developed by Meteotest, a Swiss-based company – 1985.
- Type: Hybrid dataset combining satellite data, ground measurements, and models.
3. Solcast - https://www.solcast.com/
- Source: of Australian origin – 2016 (acquired by DNV in 2023, operating as a DNV company).
- Type: satellite-based solar dataset and forecasting service, focusing on modern solar radiation data.
4. Solargis - https://solargis.com/
- Source: Slovakian company, developed by geoscientists - 2010
- Type: satellite-based solar data provider with a strong reputation for accuracy and resolution.
5. 3E (SynapticIQ) - https://www.3e.eu/
- Source: Belgium-based renewable energy consultancy and software provider - 1999.
- Type: uses Satellite-based data sources. Their tools like Solar Data Services provide satellite-derived irradiance data.
6. SolarAnywhere - https://www.solaranywhere.com/
- Source: a product of Clean Power Research, a U.S.-based software and research firm – 1998.
- Type: primarily uses Satellite-based solar irradiance data to deliver high-resolution, time-series datasets.
Table 1: A general overview of meteo data properties by different providers
| Feature | PVGIS | Meteonorm | Solcast | Solargis | 3E (SynaptiQ) | SolarAnywhere |
|---|---|---|---|---|---|---|
| Spatial Resolution | ~5 km (SARAH-3 native grid at 0.05°); ERA5-Land (~9 km), ERA5 (~30 km) to fill gaps globally | Station-interpolated globally; satellite fill at ~2–8 km depending on region | 90 m (downscaled from satellite inputs of 1–20 km) | 90 m globally (terrain downscaled using SRTM from 4 km satellite data) | 2–3 km | 500 m (High), 1 km (Enhanced), or 10 km (Standard) |
| Temporal Resolution | 30 min (native SARAH-3); often aggregated to Hourly for interface simulation | Monthly averages, stochastically disaggregated to hourly or sub-hourly | 5–60 min (live/forecast updated every 5–15 min); hourly for TMY | 15 min standard; 1 min available via synthetic data generator | 10–15 min (near real-time); hourly for historical TMY | 5 min native (High), 15–30 min (Enhanced), hourly (Standard); 1–5 min for typical year products |
| Global Coverage | Global (SARAH-3 covers Europe/Africa/parts of Asia; ERA5 fills remainder globally) | Global (station network + 5 geostationary satellites) | Global | Global (excl. polar regions due to geostationary angles) | Near-global (strongest in Europe/EMEA; global NRT API; TMY/PXX for Europe, Middle East & Africa) | Global (incl. high-latitude coverage to ±80°; high-res time series strongest in Americas and Europe) |
Note
Specifications in Table 1 are based on current publicly available provider documentation, may not be fully accurate, and are subject to change. Native satellite grid resolutions may differ from downscaled commercial products depending on the specific tier or localised terrain processing selected.
3.2. Data Bias and Uncertainty
Each dataset naturally has bias and associated uncertainty due to measurement errors or model and estimation inaccuracies. Bias refers to the systematic error in solar irradiance estimates, where values consistently deviate from actual measurements in a particular direction (either overestimating or underestimating). Uncertainty, on the other hand, is the spread or variability of these estimates, indicating the confidence in the accuracy of the data. Bias and uncertainty in meteo datasets, such as those for Global Horizontal Irradiance (GHI) or Direct Normal Irradiance (DNI), can arise from several causes, including inaccuracies in satellite-based models, imperfect ground measurements, interpolation methods, and variations in cloud cover, aerosols, and atmospheric conditions. Satellite-derived datasets might suffer from biases due to cloud detection errors or outdated aerosol models, while terrestrial data might have gaps or regional limitations.
To aggregate independent, random uncertainty factors (such as resource variability, sensor calibration, and modelling constraints) into an overall asset resource uncertainty profile ($\sigma_{resource}$), professionals typically utilise a Root-Sum-Square (RSS) methodology:
Equation 1: Resource Uncertainty Aggregation
$$\sigma_{resource} = \sqrt{\sigma_{model}^2 + \sigma_{spatial}^2 + \sigma_{interannual}^2}$$
Note
The figures in Table 2 are drawn from each provider's own validation reports and online resources, which use different ground station networks, geographies, and methodologies. Direct numerical comparison should be treated as indicative rather than definitive — the table is intended to illustrate the order of magnitude of differences, not rank providers conclusively.
Table 2: Overview of bias and uncertainty
| Dataset | Mean Bias (GHI) | Mean Bias (DNI) | Std Dev (GHI) | Std Dev (DNI) | GHI Uncertainty (Typical) | DNI Uncertainty (Typical) | Data Source Basis |
|---|---|---|---|---|---|---|---|
| Solcast | +0.33% | +1.50% | ±2.47% | ±5.75% | ±2.49% | ±5.94% | Solcast Global Validation Benchmark |
| Solargis | +0.50% | +2.20% | ±3.00% | ±6.00% | ±4.00% | ±9.00% | Solargis 320+ Site Validation Document |
| SolarAnywhere | +0.76% | +1.05% | ±2.19% | ±3.81% | ±4.29% | ±10.00% | SolarAnywhere V3.8 Technical Whitepaper |
| 3E (SynaptiQ) | +0.12% | N/A* | ±4.43% | N/A* | ±5.00% | N/A* | 3E / EURAC Independent Audit |
| PVGIS (SARAH) | +0.45% | +1.77% | ±6.60% | ±13.19% | ±6.62% | ±13.31% | Public Satellite Data Baseline / Solcast |
| Meteonorm | -0.67% | +0.27% | ±6.99% | ±15.61% | ±7.02% | ±17.12% | Meteorological Station Interpolation / Solcast |
*Because DNI is the critical metric for tracking systems, engineers are generally advised to avoid using unvalidated DNI sources for tracking projects, as it introduces unquantifiable bankability risks.
Datasets are regularly validated against actual sites by comparing the modelled data with long-term ground station measurements, statistical analysis to determine bias and root-mean-square errors (RMSE), and reports from independent third-party reviews. For bankable solar projects, validation reports from providers often include performance metrics and comparisons to ground truth data, helping to establish the reliability of the meteo data used in energy yield assessments. The typical bias and standard deviation values for datasets (measures of uncertainty) are continuously evolving as the datasets are refined, updated, or validated against new ground measurements and often depends on the validation sites and methodology used for validation.
4. Selecting the Best Dataset
There are several ways datasets can be selected to do the EYAs for a given solar project portfolio. The specific selection method or logic will depend on the purposes and desired application of such analysis, factoring in involved stakeholders and associated risk appetites. For example internal opportunity assessments may involve multi-dataset comparisons during the prospecting, greenfield, and early design phases to give a view of possible outcomes; if Data Provider A gives a high GHI and Data Provider B gives a low GHI, the internal team could look at a range of scenarios "low, central, and high". This prevents them from committing to a project using optimistic datasets. However for external bankable reports, a single, legally binding P50 (median expectation) and P90 (conservative downside) number is typically required to structure the debt-service coverage ratio (DSCR).
The choice is also driven by the financing situation, balance sheet financing, unlevered strategy, or taking a loan and the intent of the development, i.e. to own and operate or to build to sell.
4.1. Single Dataset
Using a single meteo data provider without reference to any other datasets. This approach is common amongst developers who have high confidence in one dataset provider, and prefer simplicity where a bulk purchase or single subscription is used for all sites. However, relying on one dataset for a solar project pipeline may not be the optimal choice as using a single dataset has several downsides such as:
1. A single dataset may not adequately represent extreme weather events or outlier conditions and may miss broader historical trends or variability.
2. If the dataset is based on recent measurements, it may not account for long-term climate variations or changes in weather patterns, leading to biased predictions of future performance.
3. No dataset is without error, relying on one source means that any systematic inaccuracies within that dataset will directly affect the simulations.
4. Narrower range of scenarios can be analysed, making it difficult to identify potential risks.
5. Lack of dataset cross-validation hinders the reliability of the yield predictions.
6. Single datasets may not capture insights into local climate conditions, such as microclimates that could be provided by different datasets.
7. Climate change introduces new variables that can alter weather patterns over time, using only one dataset could hinder the ability to identify these changes.
Some of the downsides above could arguably be addressed through the use of Time Series data, however the general risk of a single dataset still strongly applies.
The selection criteria for this single dataset may be based on several factors, sometimes not purely technical and mainly driven by cost or ease of use (for example some dataset can be directly imported into the simulation software like PVsyst compared to others that need additional steps to import).
4.2. Representative Dataset
In the context of multiple meteo dataset assessments, the aim is to select a single "representative" dataset from several datasets that aligns closely with actual site conditions or specific project requirements. By representative, this could mean the central case (P50), the baseline (a single dataset to anchor the study), or the middle ground of available datasets.
There are several ways/criteria for selecting such dataset, it could be done by comparing the meteo parameters (inputs to the model), e.g. proximity to measured data, statistical analyses, or multi-parameter assessments. The simplest method would be to base the selection on the dataset with the GHI closest to the average GHI of the compared datasets, however more complex weighting can be done to include multiple features such as DHI and ambient temperature which provides a more comprehensive representation of the overall meteorological conditions.
A comparison between the main meteorological parameters for four datasets from different providers was carried out on two separate solar farm locations in the UK as shown in Figure 1 and Figure 2. In Figures 1 and Figure 2 below, green colouring indicates highest values and red indicates lowest values and the average value of GHI was used as the main parameter to determine the central case.
Figure 1: Location 1
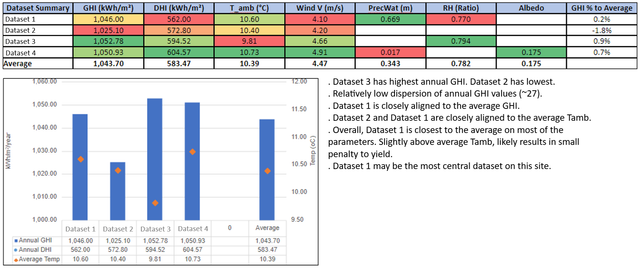
Figure 2: Location 2
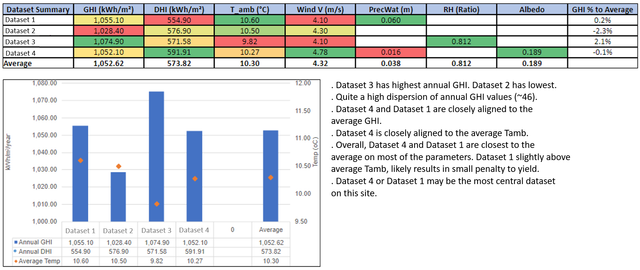
Two sites do not form a generalised view, and while acknowledging that the UK features complex microclimates, the exercise aims to identify key trends of the meteo datasets if any, to support the selection of the representative dataset to be used for design solar farms and carrying out EYAs.
The results show that for the same dataset provider the relative meteo data properties differ by site location, as expected, highlighting the risk of a single-source procurement strategy.
While selecting a single representative dataset based on meteo parameters offers simplicity, reduced modelling complexity, and easier validation against on-site measurements, committing to a single dataset may miss nuances from other datasets and includes inherent biases. This process must be done on a site by site basis, and the representative dataset provider may differ between sites.
No single dataset provider can offer data that is universally representative for all projects given meteo data variability, making the selection of the dataset for the project portfolio a non-straightforward task, eliminating the possibility of easily committing to a single dataset for a portfolio of solar projects.
Alternatively, the representative dataset could also be selected based on the output of the EYA reports rather than meteo data inputs, using the specific yield value as main metric for comparison. Because variations in meteo data inputs like temperature profiles and diffuse-to-direct irradiance ratios heavily influence inverter clipping and thermal losses, the representative dataset based on meteo inputs will not always be the same dataset based on outputs.
4.3. Dataset Blending (Weighted Average)
This method also attempts to select a representative dataset, however through combining data from different datasets aiming to leverage the strengths and compensate for the weaknesses of each dataset, providing a more robust and reliable estimate that could potentially be more representative of the future. However, it adds to the complexity of the modelling process, and requires careful consideration of how weights are assigned. Blending the datasets could be done at either:
1. the input stage, i.e. applied to the meteo parameters before running the PV simulation, or
2. as a post-processing stage on the outputs of the PVsyst simulation
Averaging the meteorological data from different sources before running the simulation in PVsyst can provide a single set of inputs, simplifying the simulation process, reducing computational power/time, and maintaining the standard PVsyst report format for the output, but this approach has potential drawbacks compared to running separate simulations for each dataset and then averaging the results. Averaging can mask differences and nuances between datasets as each dataset may have unique characteristics and trends that contribute to a more accurate simulation. Solar PV system performance also exhibits non-linear responses to changes in meteorological conditions such as temperature effects on PV efficiency and shading impacts. Averaging the data before the simulation might not capture these non-linearities accurately.
Different datasets may have varying levels of accuracy and resolution, and averaging them assumes equal reliability and relevance, which might not be the case. Some datasets might be more accurate for specific regions or conditions. If the datasets have different temporal resolutions (e.g., hourly vs. daily), averaging them could introduce inaccuracies, this is particularly relevant for high-resolution simulations where hourly or sub-hourly data is critical, and not relevant for TMY data.
Running separate simulations using the original datasets and doing the weighted average as a post process preserves the integrity and specific characteristics of each dataset, which can lead to a more accurate representation of the expected performance. After running separate simulations, weights can be applied to the results based on the confidence or historical accuracy of each dataset. This provides a more sophisticated and potentially more accurate yield estimate. Running separate simulations allows a comparative analysis of the results, identifying outliers or significant discrepancies between datasets. This can highlight potential issues or uncertainties in the meteo data. It enables sensitivity analysis to understand how different meteorological conditions impact the system performance, providing deeper insights into the reliability and robustness of the PV system design. This approach is more complex as it requires running multiple simulations which can be time consuming, in addition to the requirement of a method to calculate and store the weighted average(s) in a standardised manner. The post processing also requires the storage and distribution of multiple PVsyst simulation reports for each project.
On balance, post-processing output blending is generally preferable as it preserves each dataset's integrity through the non-linear simulation engine, input blending is a reasonable shortcut where simulation time is constrained.
Assigning Weights to Datasets
The assignment of weights to each dataset should reflect the relative confidence placed in each source, informed by factors such as uncertainty (bias and standard deviation), spatial resolution, proximity to ground-measured data, and validation quality. While there is no universally accepted scientific method for deriving these weights, a pragmatic and transparent approach can be adopted that is grounded in the available evidence.
Weights can be derived from a combination of: published GHI uncertainty figures (lower uncertainty → higher weight), spatial resolution relative to site size, and proximity of validation sites to the project geography. For example, a dataset validated extensively across Northern Europe warrants a higher weight for a UK project than one validated primarily in sunbelt regions. The key principle is that weights should be documented and reproducible, even if the methodology is pragmatic rather than mathematically precise.
As a working example, consider a case where four datasets are available. Rather than applying equal weights (25% each), higher weights are assigned to datasets with lower overall uncertainty and better spatial resolution, with weights tapering for sources considered less reliable or less well-validated for the region in question. A reasonable starting point could follow a distribution such as:
Table 3: Worked Example
| Dataset | Weight | Rationale |
|---|---|---|
| Dataset A | 35% | Lowest uncertainty, highest spatial resolution |
| Dataset B | 30% | Low uncertainty, good regional validation |
| Dataset C | 20% | Moderate uncertainty, acceptable resolution |
| Dataset D | 15% | Higher uncertainty or lower resolution |
This produces a weighted average that is meaningfully differentiated rather than a simple mean, while remaining close enough to an equal split that no single dataset dominates the result. The weights sum to 100% and the spread (35/30/20/15) reflects a graduated confidence rather than an arbitrary ranking. Where fewer datasets are available, the weights should be redistributed proportionally. For example, if only three datasets are accessible, a comparable distribution might be 40/35/25, maintaining the principle that better-validated sources carry more influence. With two datasets, a 60/40 split may be appropriate where one is clearly superior, or 50/50 where confidence is broadly equal. It is important to acknowledge that this weighting scheme carries inherent subjectivity. The intent is not to claim scientific precision but to introduce a structured, defensible, and reproducible basis for combining datasets, one that is more rigorous than selecting a single central case, while remaining practical for project-level assessments. Weights should be revisited periodically as new validation reports are published and datasets are updated.
As part of the exercise and to see the impact of data uncertainty on the specific yield calculation, four different PVsyst simulations were conducted, and the corresponding specific yields were obtained. Specific yield (kWh/kWp) is a key performance metric used in the solar PV industry to evaluate the efficiency and performance of a solar PV system. The uncertainty ($\pm$) was applied to each figure and plotted for comparison against the calculated weighted average as shown in Figure 3.
Figure 3: An example of the uncertainties applied to specific yield

Bankability Warning
While blending multiple datasets creates a robust internal engineering baseline, lenders and tax equity investors prefer clean traceability. If an IE receives a PVsyst report based on a custom-blended meteorological file, they may apply an additional "methodological uncertainty penalty" (increasing the overall project $\sigma$, which lowers the debt-sizing P90 value).
Best Practice is to run the nominal asset simulation using the single most reputable, validated satellite dataset for that specific microclimate to serve as the Bankable P50 Base. Use the weighted average or output-blended approach strictly to define the model uncertainty bounds and validate that the chosen baseline isn't an aggressive outlier.
This presents a practical tension: weighted averaging improves robustness for internal engineering assessments, but may introduce traceability concerns in formal lender submissions. For the purposes of this article, the weighted average approach is recommended as a best-practice engineering tool for design, optioneering, and risk awareness — rather than as a direct input to a bankable report, where a single well-validated dataset typically remains preferred.
4.4 Scenario Analysis (No Selection)
While selecting a single dataset is required to anchor the final, bankable EYA report, restricting the assessment to a single dataset during early-stage development introduces significant commercial blind spots. A robust internal opportunity assessment should use a multi-simulation approach ($N$ simulations using $N$ distinct datasets).
This establishes a clear "Low-Central-High" range of potential energy yields, allowing commercial teams to stress-test financial models, evaluate IRR sensitivity, and understand revenue volatility before committing capital. While lenders ultimately require a singular P50/P90 output for project financing, this internal scenario analysis ensures that the project's economic viability is protected against meteorological dataset divergence.
5. Feedback from the Industry
The following reflects informal conversations with industry contacts and should be read as qualitative context rather than representative industry consensus.
The topic of meteorological datasets has been investigated through professional connections and at industry events such as Intersolar. The following were the main points (mostly June 2024):
1. Satellite-based data provider A is very confident in their datasets and only recommends using their own data, not considering other sources.
2. Interpolated data provider B: eventhough their data was historically interpolated hourly through weather station data, they disagree that this results in lower accuracy, indicating their modern versions natively integrate satellite data, and they have a recent benchmark supporting this. They offer a paid time series service. They agree with the importance of checking multiple datasets when assessing solar site yield; while they have no strong view on weighted averaging, they do not oppose it.
3. Independent assessor / data comparison provider: They have a tool that compares different datasets and recommends which is most suited depending on site location and available data. Their view is to select the dataset that appears best for the particular site. They are not against weighted averaging but recommend it is applied to the outputs rather than the inputs.
4. EYA service provider: They have their own solar datasets and are willing to provide a quote. Their solar irradiation expert agrees with the weighted average approach — this is what they currently do in assessments. However, they previously applied weighted averaging to outputs (specific yields) and now apply it to input GHI data only, leaving temperature and wind speed data unmodified.
5. Engineering consultancy A: One engineer noted they typically use a leading satellite-based dataset but have seen weighted averaging applied previously — limited detail was provided on methodology.
6. Engineering consultancy B: A contact reported they used five datasets and applied weighted averaging on the inputs, noting that one leading satellite-based dataset tended to be closest to the average in general.
7. Solar developer A: Primarily uses a leading satellite-based dataset for simulations.
8. Solar developer B: A contact at this developer indicated they always use an interpolated hourly dataset.
6. Other Considerations
6.1. Simulations
Solar simulations use TMY datasets as inputs for weather conditions and because TMY data is representative of the climate conditions over a long period, the simulations produce a central, most-likely energy yield estimate, which corresponds to the P50 value. The P50 value is the level of energy production that has a 50% probability of being exceeded (and a 50% probability of not being exceeded). In other words, it is the median value of expected energy production, often used as the base case for project assessments and financial modelling. Since a P50 simulation is designed to model the most likely scenario, it is important that the selected dataset is representative of the typical long-term weather patterns for the project location. In data science terms, the goal here is generalisation rather than overfitting.
Finding the most accurate dataset is useful, but it is more important that the dataset captures the average climate conditions over the years rather than focusing on short-term accuracy or recent extremes.
While P50 focuses on the most likely outcome, risk management often involves understanding P90 or P99 scenarios, which represent lower yields and account for worst-case conditions. In this context, focusing on just one dataset (even if it’s accurate for the present) can underestimate risks associated with natural variability and uncertainty. This is where using multiple datasets or considering uncertainty from different sources becomes important.
6.2. Updated Datasets
Datasets are continuously improving, therefore the assumptions and methodology used for assessing solar sites, and running simulations and EYAs should be continuously revised against the latest available datasets, including the weights assigned for each dataset when performing the weighted average approach. This document includes information on and refers to PVGIS 5.2 uncertainty figures. however, recently, PVGIS 5.3 was released which includes several improvements such as an update of the temporal coverage of current PVGIS solar radiation and meteorological datasets up to the year 2023, and datasets now include the satellite-based SARAH-3 and reanalysis ERA5+Land (a combination of the high resolution ERA5-Land with an interpolated version of ERA5 around the coastlines).
6.3. Uncertainty
Uncertainty in PV energy estimates is "one of the most critical areas of lack of understanding" according to independent engineers, financiers, PV model developers, and other industry stakeholders. The primary problem is a lack of rigorous, transparent, widely accepted methods for quantifying uncertainty in energy production estimates. Uncertainty in energy production estimates not only arises from variability of the solar resource, but also from inexact PV performance models and their parameters, and system reliability considerations. Uncertainty in annual energy production is frequently calculated for larger projects to quantify financial risk. Key statistics for energy, such as the P50 and P90 are used by financing institutions to calculate the repayment risk for the project. The current methods to estimate these statistics are typically proprietary, specialised, and involve significant post-processing of commercial performance model results. While there is focus on selecting the meteo dataset best for the project, there are many other factors that affect the project yield and uncertainty which are not currently included in standard commercial models. Figure 4 below shows some of the additional uncertainty factors.
Figure 4: Default distributions for uncertainty factors (Source: Quantifying Uncertainty in PV Energy Estimates Final Report 2023)
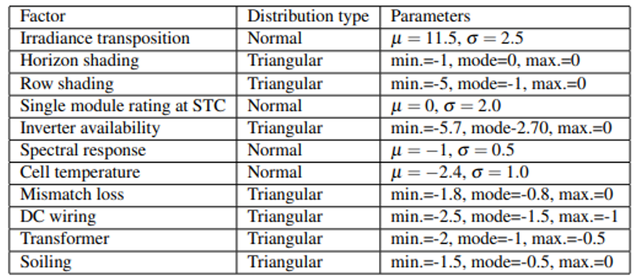
To put this into a formal framework, meteorological variance is merely the resource component of a much larger, compounding uncertainty budget. When an Independent Engineer (IE) builds the final project risk profile, they will combine this weather data variance with the independent standard deviations ($\sigma$) of module performance tolerances, inverter modelling assumptions, long-term degradation rates, and operational availability. These components are typically aggregated using a root-sum-square approach to determine the overall statistical downside spread, meaning that an over-focus on perfecting the weather data covers only a fraction of the total financial risk.
6.4. Forecasting the Future
Using historical TMY data to forecast future solar energy yields is in principle a flawed process especially in the context of climate change. TMY datasets are constructed by selecting representative months from historical weather data to create a "typical" year, but they are backward-looking and do not account for potential future shifts in climate conditions. This method, while useful for estimating energy yields based on past climate behaviour, has inherent limitations when forecasting for the future. TMY data assumes that the past is a reliable predictor of future conditions, which is increasingly not the case as the climate shifts. Solar irradiance, wind patterns, and temperature variations that influence solar PV performance may all change in ways that TMY cannot anticipate. To ensure more accurate forecasts, it is important to incorporate climate-adjusted projections, run scenario analyses, and use multiple datasets to capture future uncertainty.
Some providers are beginning to offer climate-adjusted datasets or future scenario layers. While not yet standard practice, engineers working on projects with 25+ year asset lives should be aware these tools exist and monitor their development.
6.5 The Shift to Multi-Year Simulations
While TMY is standard for P50, modern IEs and lenders are increasingly demanding Multi-Year Time Series Simulations (running 20 separate annual simulations for 20 individual years). However, this is mainly driven by the integration of BESS with solar systems, given TMY cannot accurately model BESS operation including degradation, PPA clipping losses, co-location topology (AC vs. DC-coupled), charging arbitrage, state-of-charge cycling, or multi-day weather persistence for solar-plus-storage projects. For solar-only projects, TMY remains appropriate for P50 estimation, but engineers should be aware that this shift is already influencing how lenders and IEs scope their review requirements.
7. Areas for Further Exploration
Below are some areas for further exploration that could support the assessment of solar projects:
1. Validating datasets against on-site pyranometer measurements, even a single operational asset with a calibrated sensor can provide valuable ground truth to test which dataset performs best for that microclimate and geography.
2. Developing a more systematic, reproducible framework for assigning dataset weights, one that could eventually be shared or standardised across the industry.
3. Revisiting the weights given to each dataset against more recent dataset validation reports and keeping up to date with latest updates in the TMY dataset space.
4. Obtaining access for additional datasets may enhance the optioneering capability and assessment and allows incorporating more data into the weighted average model.
5. Exploring meteo data comparison tools such as those provided by some consultants.
6. Exploring climate-adjusted projections of meteo data.
7. Exploring uncertainty analysis / yield contingency to be applied in the commercial model.
8. Engineers and developers looking to mature their approach may also consider procuring short-term on-site measurements during development — even 12 months of pyranometer data can meaningfully calibrate satellite-derived models for a specific microclimate.
8. Summary
In some regions with low solar irradiation, solar PV projects are facing increasing challenges in maintaining profitability and achieving hurdle rates due to a combination of factors such as rising competition, fluctuating energy prices, increased construction and grid connection costs, and changes in government incentives. As a result, precise and accurate modelling of energy generation potential has become crucial for project feasibility and financial viability. The performance predictions of solar PV systems are significantly influenced by the selected meteorological datasets, as these datasets provide the foundation for understanding solar irradiance patterns, temperature variations, and other climatic conditions affecting energy yield. Despite the additional cost associated with the purchase of data, employing several meteorological data sources allows a more robust assessment of potential performance thereby informing investment decisions and risk management strategies. Selecting the best meteorological dataset for solar PV project modelling is a complex task, as it requires careful consideration of various factors that influence data quality and reliability. Each dataset, whether sourced from satellite, terrestrial measurements, or hybrid methods, comes with its own set of biases, uncertainties, and limitations. The challenge lies in understanding the specific context of the project, including geographic location, local climate conditions, and the intended application of the data. This variability can lead to different datasets producing divergent energy yield estimates, complicating the decision-making process. To address these discrepancies, various solutions can be considered, however as a practical starting point: compare at least three datasets per site, identify the representative case by proximity to the GHI mean, and use post-processed weighted averaging to define your uncertainty envelope — treating the result as an engineering tool rather than a bankable submission. The goal is not perfection, but a more honest and transparent representation of what we know, what we assume, and where the uncertainty lies.
9. The Big Picture
Finally, it is worth stepping back to recognise that the Energy Yield Assessment is only one piece of a much larger and more uncertain picture. The Levelised Cost of Energy (LCOE) — the metric that ultimately determines whether a solar project is financially viable — carries its own substantial uncertainties that dwarf even the most carefully constructed EYA, a battle that many engineers continuously wage with their commercial modelling counterparts. Future energy prices, which underpin revenue projections across a 30-40 year asset life, are notoriously difficult to forecast and sensitive to policy shifts, market liberalisation, and the broader energy transition. Operations and maintenance cost assumptions, availability factors, degradation rates, and insurance costs all introduce compounding uncertainty into the financial model.
When the technical uncertainties discussed in this article (dataset bias, inter-annual variability, soiling, shading, and modelling assumptions) are layered on top of these commercial unknowns, the result is a project economics model with a very wide confidence interval.
Crucially, we must keep the actual scale of meteorological variance in perspective. Despite the technical debates between top-tier data providers, the real-world difference between their long-term GHI estimates is usually quite tight—typically well under 10%. While a 5% or 8% swing can be presented in a boardroom as a "make-or-break" metric for a project's viability, the truth is that if a solar farm's commercial survival hinges entirely on choosing Data Provider A over Data Provider B, that dependency tells you everything you need to know about the fragile, risky economics of the opportunity itself.
I believe a healthy project should easily absorb this minor data divergence. Given that the final performance of a solar farm relies on dozens of compounding mechanical, environmental, and market factors, treating the weather dataset selection as the ultimate battleground can quickly become an exercise in commercial overkill. This is not to say our earlier analysis doesn't matter; rather, it defines the true purpose of rigorous dataset selection. Precision in the EYA is worthwhile, but it should be held in proportion, i.e. getting the meteorological dataset right matters, but it is merely one input into a financial framework that carries far greater sensitivity to macro assumptions we have even less ability to control. The goal of a multi-dataset approach is not to hunt for a non-existent magic bullet, but simply to prove that your investment isn't sitting on a dangerous outlier.
The PV Expert